Instruments Help
About Instruments
Instruments Overview
Instruments is a powerful and flexible performance-analysis and testing tool that’s part of the Xcode tool set. It’s designed to help you profile your iOS, watchOS, tvOS, and macOS apps, processes, and devices in order to better understand and optimize their behavior and performance. Incorporating Instruments into your workflow from the beginning of the app development process can save you time later by helping you find issues early in the development cycle.
profile: an analysis (often in graphical form) representing the extent to which something exhibits various characteristics 一种分析(通常以图形形式),表示某物表现出不同特征的程度
Instruments是一个功能强大且灵活的性能分析和测试工具,属于Xcode工具集的一部分。它旨在帮助您分析您的iOS、watchOS、tvOS和macOS应用程序、流程和设备,以便更好地理解和优化它们的行为和性能。从应用程序开发过程的一开始就将工具合并到您的工作流中,可以帮助您在开发的早期发现问题,从而节省您的时间。
In Instruments, you use specialized tools, known as instruments, to trace different aspects of your apps, processes, and devices over time. Instruments collects data as it profiles, and presents the results to you in detail for analysis. 在Instruments中,您使用专门的工具(Instruments)来跟踪应用程序、流程和设备的不同方面的问题。Instruments收集数据进行分析,然后把分析结果以图表的形式向您展示,以便您进行详细分析。
Unlike other performance and debugging tools, Instruments allows you to gather widely disparate types of data and view them side by side. This makes it easier to identify trends that might otherwise be overlooked. For example, your app may exhibit large memory growth caused by multiple open network connections. By using the Allocations and Connections instruments together, you can identify connections that are not closing and thus resulting in rapid memory growth.
与其他性能和调试工具不同,Instruments使您能够收集广泛不同类型的数据并并排查看它们。这使得识别可能被忽略的趋势变得更加容易。例如,您的应用程序可能会由于打开了多个网络连接而出现较大的内存增长。通过将Allocations和Connections工具一起使用,您可以识别没有关闭的连接,从而找到导致内存快速增长的原因。
By using Instruments effectively, you can: 为了有效使用Instruments,你可以这么做:
-
Examine the behavior of one or more apps or processes 检查一个或多个应用程序或进程的行为
-
Examine device-specific features, such as Wi-Fi and Bluetooth 检查特定设备的特性,比如Wi-Fi和蓝牙
-
Perform profiling in a simulator or on a physical device 在模拟器或物理设备上进行性能分析
-
Track down problems in your source code 跟踪源代码中的问题
-
Conduct performance analysis on your app 对应用程序进行性能分析
-
Find memory problems in your app, such as leaks, abandoned memory, and zombies 在你的应用程序中发现内存问题,比如内存泄露和僵尸对象
-
Identify ways to optimize your app for greater power efficiency 找出优化应用程序的方法,以提高电源效率
-
Perform general system-level troubleshooting 执行一般的系统级故障排除
-
Save instrument configurations as templates 将instrument配置保存为模板
-
Although it’s embedded within and may be used with Xcode, Instruments is a separate app, which may be used independently as needed. 虽然Instruments是内嵌的,与Xcode一起使用,但是Instruments是一个独立的应用程序,可以根据需要独立使用。
About the trace document 关于跟踪文档.
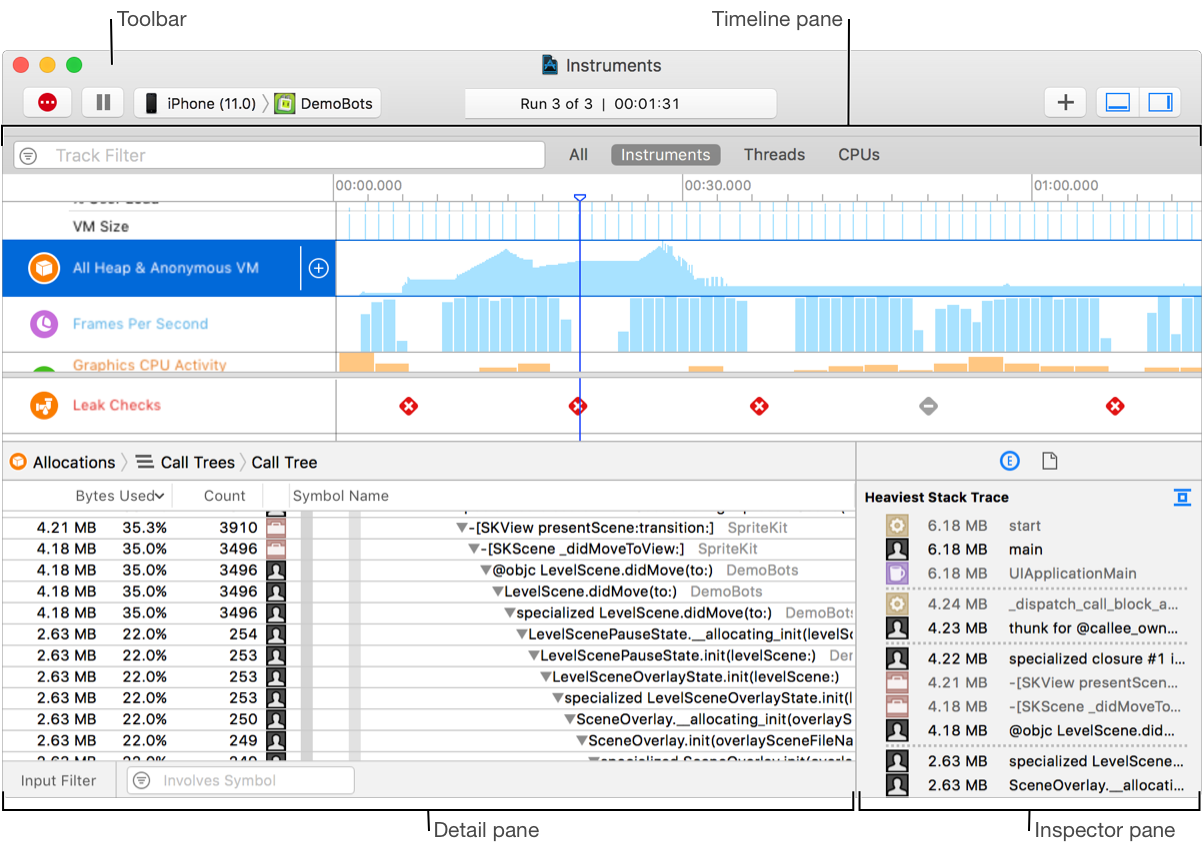
A trace document is used to organize and configure instruments for profiling, initiate data collection, and view and analyze the results. You create a new trace document by launching Instruments and choosing a profiling template or by initiating profiling from Xcode, the Dock, or the command line. You can also save and reopen trace documents in which you’ve configured instruments and collected data. A trace document can contain a lot of extremely detailed information, and this information is presented to you through a number of panes and areas.
跟踪文档用于组织和配置用于分析,初始化数据收集以及查看和分析结果的instruments环境。通过启动Instruments并选择一个概要分析模板,或者通过Xcode、Dock或命令行启动概要分析,您可以创建一个新的跟踪文档。您还可以保存和重新打开已经配置好了的Instruments环境和收集的跟踪文档数据。跟踪文档可以包含许多非常详细的信息,这些信息通过许多窗格和区域来展示。
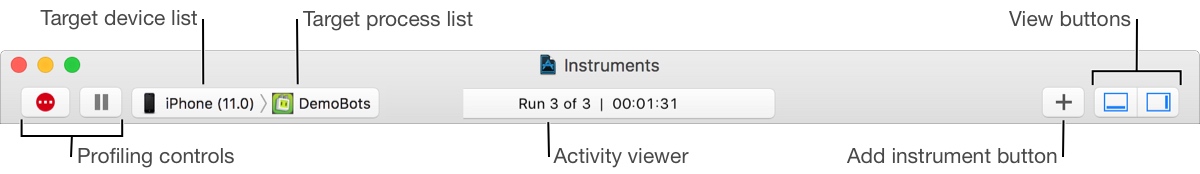
About the trace document toolbar.
The toolbar of the trace document lets you start, pause, and stop data profiling, add instruments, hide and show panes, and more. 跟踪文档的工具栏允许您启动、暂停和停止数据分析、添加分析工具、隐藏和显示窗格等等。
The toolbar includes the following main elements: 工具栏包括以下主要元素:
-
Profiling controls: Allow you to record, pause, and stop data collection. 允许您记录、暂停和停止数据收集。
-
Target device list: Allows you to select the device on which you wish to profile. 允许您选择您希望配置文件的设备。
-
Target process list: Allows you to select the process or processes to profile. 允许您选择要分析的应用程序。
-
Activity viewer: Shows the number of runs for the trace document and the elapsed time of the current trace. 显示跟踪文档的运行次数和当前跟踪的运行时间。
-
Add Instrument button (+): Shows or hides the instruments Library palette, which contains a complete list of available instruments. From here, you can select individual instruments and add them to your trace document. 显示或隐藏工具库面板,其中包含可用工具的完整列表。从这里,您可以选择单独的工具并将它们添加到跟踪文档中。
-
View buttons (
 ): Hide or show the detail pane and inspector. 隐藏或显示详细窗格和检查器。
About the trace document timeline pane 跟踪文档时间轴窗格
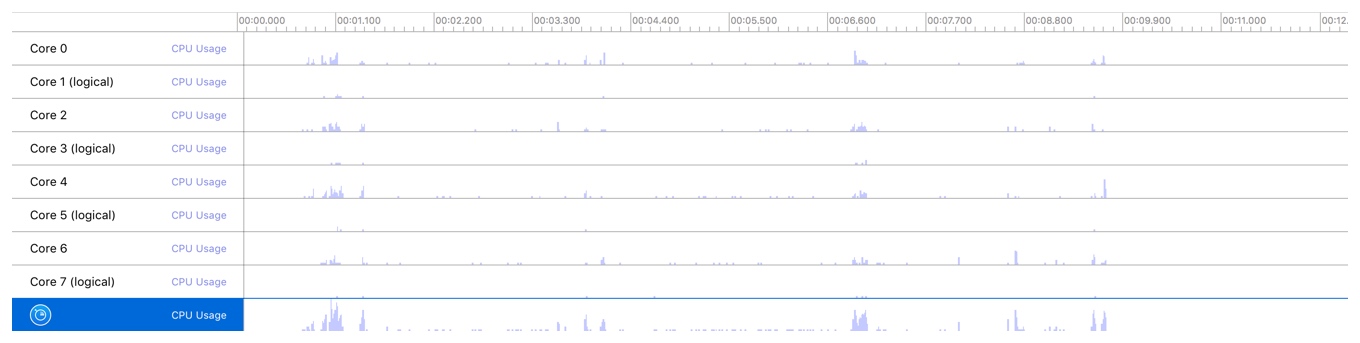
The timeline pane displays a graphical summary of the data recorded for a given trace. In this pane, each instrument, CPU core, or thread has its own “track,” which provides a graphical chart of the data collected. 时间轴窗格显示为给定跟踪记录的数据的图形化摘要。在这个窗格中,每个仪器、CPU内核或线程都有自己的“磁道”,它提供了收集的数据的图形图表。
Although this pane’s information is read-only, you can scroll through data, select specific areas for closer examination, and insert flags to highlight points of interest. You can change how graphical information is displayed here by adjusting the zoom level or by changing the display settings of individual instruments using the display configuration popover. An optional filter bar provides controls for filtering the data displayed by an instrument. For example, the Sampler instrument can filter the data by thread. 尽管此窗格的信息是只读的,但您可以滚动数据,选择要进行更仔细检查的特定区域,并插入标记以突出感兴趣的点。您可以通过调整缩放级别或使用display配置弹窗更改单个仪器的显示设置来更改这里显示图形信息的方式。可选的过滤条提供用于过滤仪器显示的数据的控件。例如,采样器可以通过线程对数据进行过滤。
You can pin timelines to the bottom of the pane to keep important information visible as you investigate issues. For example, you can pin the Leaks instrument to the bottom of the pane, and then scroll through the other instruments to find the possible causes for a leak. Pinned instruments are not preserved between runs. 您可以将时间线固定在窗格的底部,以便在研究问题时保持重要信息的可见性。例如,您可以将泄漏工具固定在窗格的底部,然后滚动其他工具以查找泄漏的可能原因。固定的仪器在运行之间不能保存。
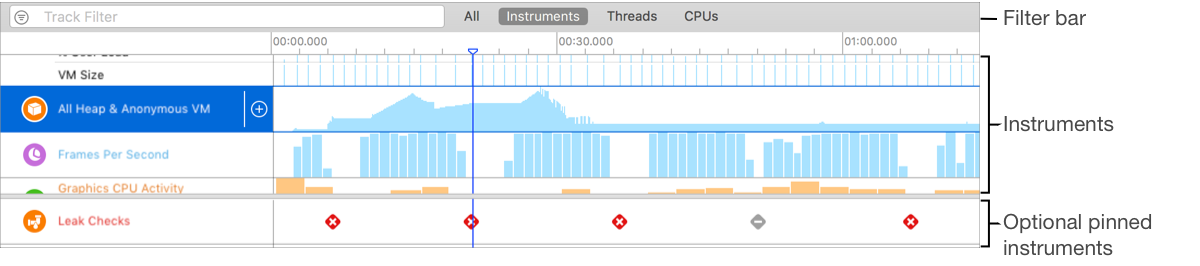
Strategy views 视图策略
Click the strategy buttons in the filter bar to display instruments, CPU core, thread data, or all three items in the timeline. 单击过滤器栏中的策略按钮,以显示时间轴中的instruments、CPU core、thread data或所有三个项目。

All: Show data for instruments, threads, and CPUs in the timeline. All:在时间轴中显示 instruments, threads, and CPUs。
CPUs: Displays a list of CPU cores, along with their usage over time, in the timeline pane. Only available when a trace document contains instruments that record CPU data. CPUs: 在时间轴窗格中显示CPU core的列表及其随时间的使用情况。只有当跟踪文档包含记录CPU数据的工具时才可用。
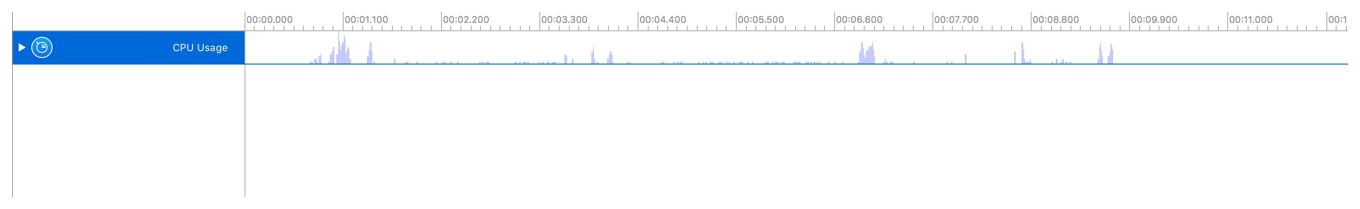
Instruments: Displays a list of instruments and their corresponding data in the timeline pane. Instruments: 在时间轴窗格中显示工具列表及其相应的数据。
If you select an instrument in the list, you can delete it or configure it in the inspector pane. The instruments list is visible by default when you create a trace document. 如果您在列表中选择一个工具,您可以删除它或在inspector窗格中配置它。在创建跟踪文档时,默认情况下,instruments列表是可见的。
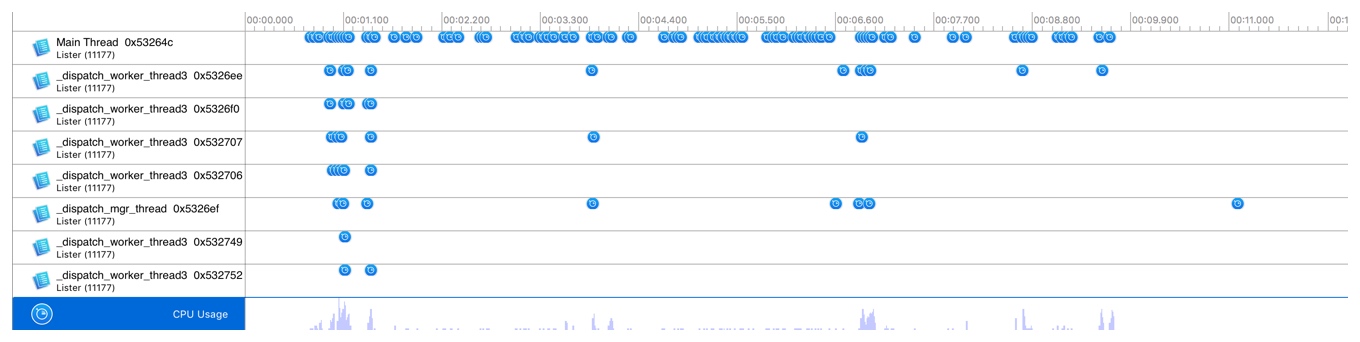
Threads: Displays a list of threads and their utilization data in the timeline pane. Only available when a trace document contains instruments that record thread data. Threads: 在时间轴窗格中显示线程列表及其利用率数据。只有当跟踪文档包含记录线程数据的工具时才可用。
About the display configuration popover 关于弹出的配置界面
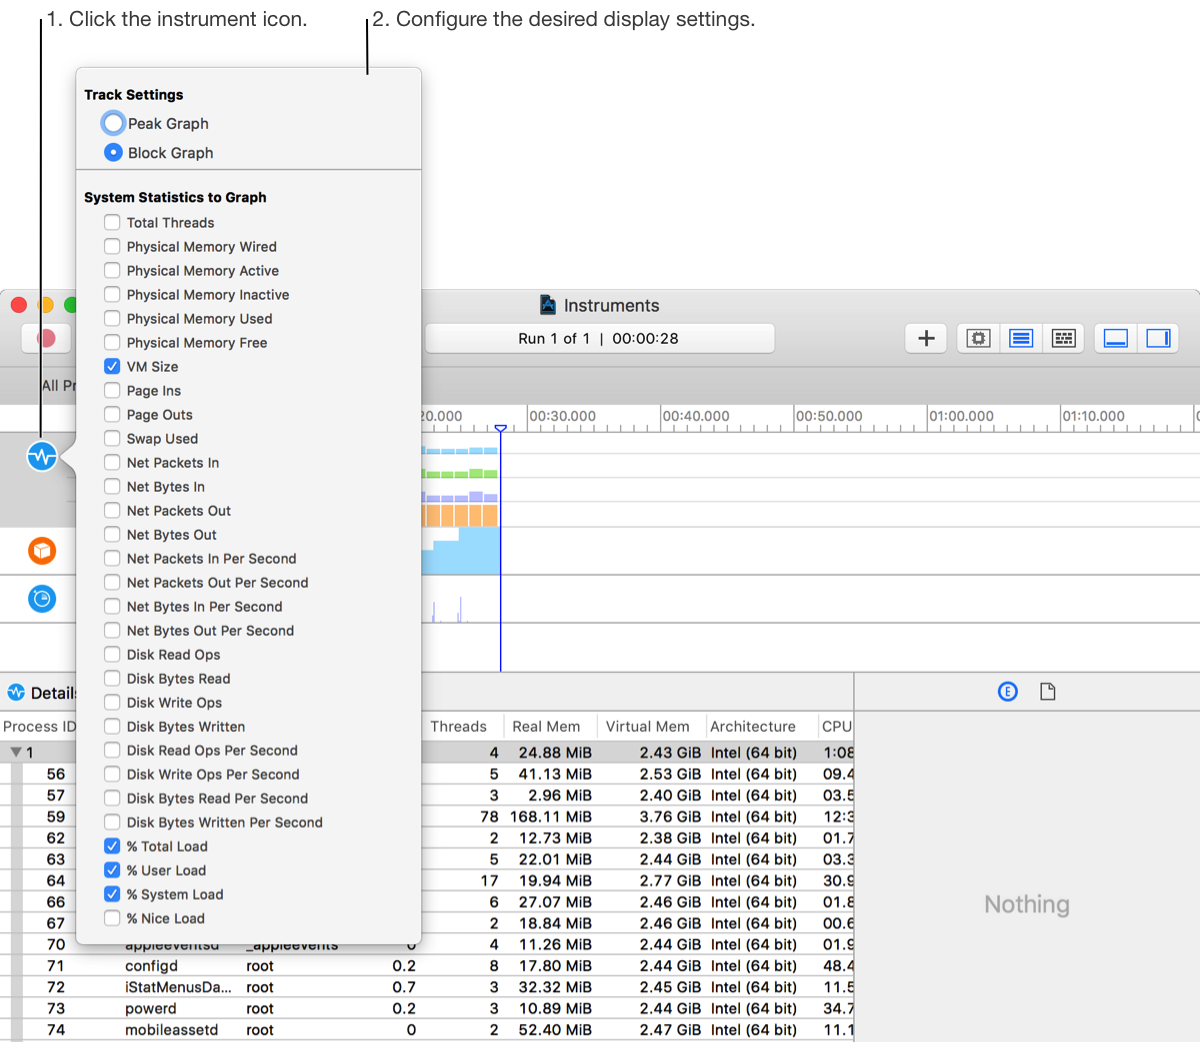
Use the display configuration popover to configure what data is displayed in the timeline and to configure the format of the displayed data. 使用弹出的配置界面 配置时间轴中显示的数据和显示数据的格式。
The settings available in the display configuration popover vary, depending on the instrument. These settings can help you: 根据选择的工具的不同,弹出的配置界面中可用的设置也不同。这些设置可以帮助你:
-
Control the data that appears in the timeline. For example, the Activity instrument allows you to toggle the display of total threads, VM size, and several other system statistics. 控制出现在时间轴上的数据。例如,Activity工具允许您切换总线程、VM大小和其他一些系统统计信息的显示。
-
Adjust how recorded information is represented in the timeline view. For example, an instrument may allow you to switch between a peak graph and a block graph. 调整记录信息在时间轴视图中的表示方式。例如,一个工具可以让你在峰值图和方块图之间切换。
To open the popover, click the instrument icon in the trace document timeline pane. Instruments that support a display configuration popover show an indicator when the pointer is moved over the icon. 要打开配置界面,单击跟踪文档时间轴窗格中的工具图标。当指针移动到图标上方时,支持显示配置界面的工具会显示一个指示器。
About the trace document detail pane 关于跟踪文档详细信息窗格
The detail pane shows detailed information about the data collected by the instruments in your trace document. Select an individual instrument in the timeline pane to see the data it collected while profiling. 详细信息窗格显示跟踪文档中工具收集的数据的详细信息。在时间轴窗格中选择一个单独的工具,以查看它在分析时收集的数据。
The detail pane consists of three main areas, the navigation bar, the collected data area, and the filter and configuration bar. 详细信息窗格由三个主要区域组成:导航栏、收集的数据区、筛选器和配置栏。
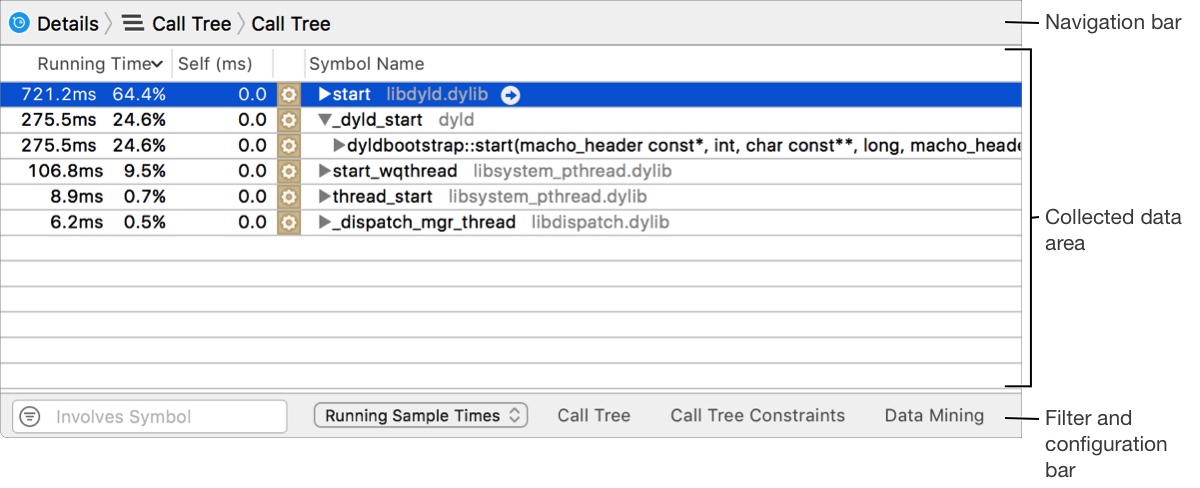
Navigation bar
The navigation bar at the top of the detail pane helps you browse through collected data. 导航栏在细节窗格的顶部,帮助您浏览收集的数据。
You can use the navigation bar to switch between types of data and to navigate through different levels of data. 您可以使用导航栏在不同类型的数据之间切换,并在不同级别的数据之间导航。
-
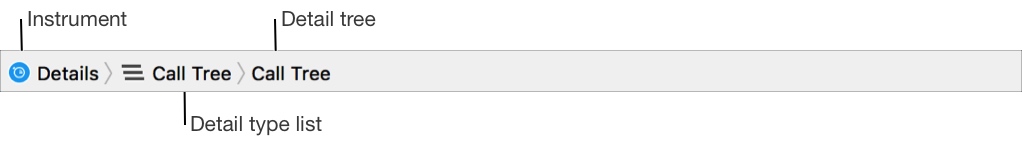
Instrument: Icon of the currently selected instrument in the timeline pane. Click this to view the console for the instrument. Instrument:时间轴窗格中当前选定工具的图标。单击此处查看仪器的控制台。
-
Detail type list: Allows you to navigate between different types of data. The options displayed here vary, depending on the actively selected instrument. For many instruments, the list includes things like a summary of data, a call tree, and a console. Detail type list: 允许您在不同类型的数据之间导航。这里显示的选项根据所选工具的不同而有所不同。对于大部分工具来说,列表包括 a summary of data, a call tree, and a console。
-
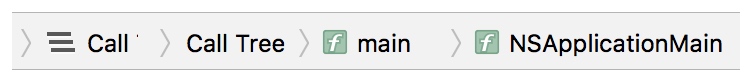
Detail tree: Keep track of where you are in the hierarchy as you navigate through the data in the detail pane. Click a branch of the tree to move back up the hierarchy to the corresponding data. Detail tree: 在详细信息窗格中浏览数据时,请跟踪在层次结构中的位置。单击树的一个分支,以向上移动到相应数据的层次结构。
Collected data area 数据收集区
The collected data area shows you all of the data for the selected instrument, typically in tabular format. The content displayed here varies significantly from instrument to instrument. For example, the Activity Monitor instrument displays process, CPU, and thread information, and much more. 数据收集区域显示所选工具的所有数据,通常以表格格式显示。这里显示的内容因使用的工具而异。例如,Activity Monitor工具显示进程、CPU和线程信息等等。
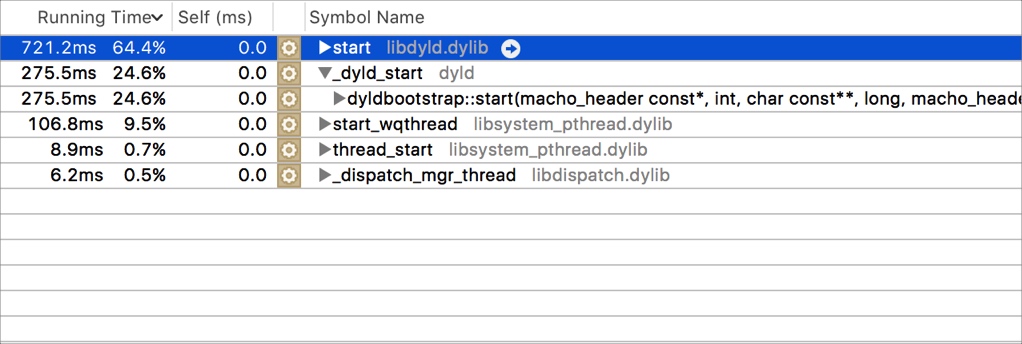
Often, individual symbols and data points within this area contain navigation buttons  , which appear when you move your pointer over them. You can click these buttons to move deeper into the data. As you do, the detail tree in the navigation bar updates to reflect where you are in the hierarchy.
通常,该区域内的单个符号和数据点包含导航按钮, 当您将指针移动到这些按钮之上时,导航按钮就会出现。您可以单击这些按钮来深入了解数据。正如您所做的,导航栏中的细节树将更新以反映您在层次结构中的位置。
, which appear when you move your pointer over them. You can click these buttons to move deeper into the data. As you do, the detail tree in the navigation bar updates to reflect where you are in the hierarchy.
通常,该区域内的单个符号和数据点包含导航按钮, 当您将指针移动到这些按钮之上时,导航按钮就会出现。您可以单击这些按钮来深入了解数据。正如您所做的,导航栏中的细节树将更新以反映您在层次结构中的位置。
Filter and configuration bar 筛选器和配置栏
The filter and configuration bar at the bottom of the detail pane helps you filter the collected data and configure how that data is displayed. 详细信息窗格底部的filter and configuration bar帮助您筛选收集的数据并配置数据的显示方式。
-
Filter field: Allows you to filter collected data for a specific term. Click the filter field’s menu for some additional filtering options. You can also filter collected data more extensively by adjusting display settings in the display configuration popover. Filter field: 允许您为特定的术语过滤收集的数据。单击filter字段的菜单以获得一些额外的过滤选项。您还可以通过调整display configuration popover中的显示设置来更广泛地过滤收集的数据。
-
Display configuration controls: Refine the displayed results by filtering, sorting, and data mining. The controls vary from instrument to instrument and can include menus for selecting different views of the results, and popovers for constraining the data that is shown. Display configuration controls: 通过过滤、排序和数据挖掘来细化显示的结果。控件因仪器而异,可以包括用于选择结果的不同视图的菜单,以及用于约束显示的数据的弹窗。

About the trace document inspector pane 关于跟踪文档检查器窗格
The inspector pane contains information about the run that’s currently displayed in the detail pane. It includes information about the recording and, for some instruments, additional details about the selected data. inspector窗格包含关于当前显示在详细信息窗格中的运行的信息。它包括有关记录的信息,对于某些仪器,还包括有关所选数据的额外细节。
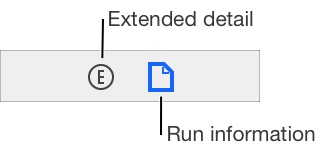
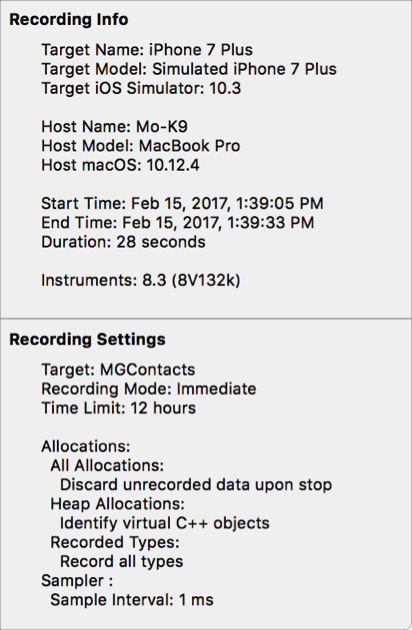
Run information area 运行信息区
The run information area shows information about the run displayed in the detail pane including the target, recording time, and the settings used for the recording. 运行信息区域显示详细窗格中显示的运行信息,包括目标、记录时间和记录使用的设置。
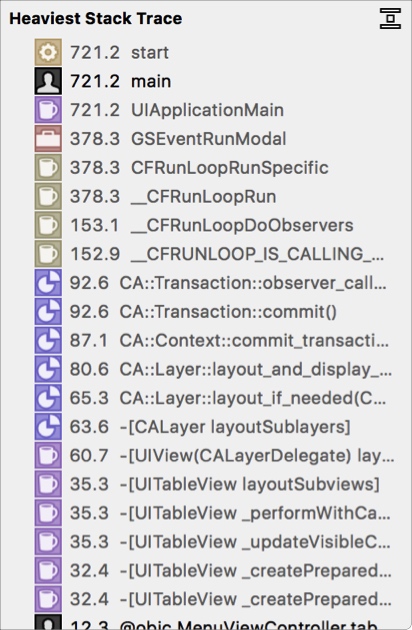
Extended detail area 扩展详细信息区域
The extended detail area is used to display additional instrument-specific information about selected data in the detail pane, such as a complete stack trace. 扩展详细信息区域用于在详细信息窗格中显示关于所选数据的附加特定于工具的信息,例如完整的堆栈跟踪。
About the Library palette 关于库调色板
The Library palette provides a complete list of available instruments and lets you add them to your trace documents. Here, you can browse instrument descriptions and filter for a specific instrument. Library palette提供了可用工具的完整列表,并允许您将它们添加到跟踪文档中。在这里,您可以浏览仪器描述并过滤特定的仪器。
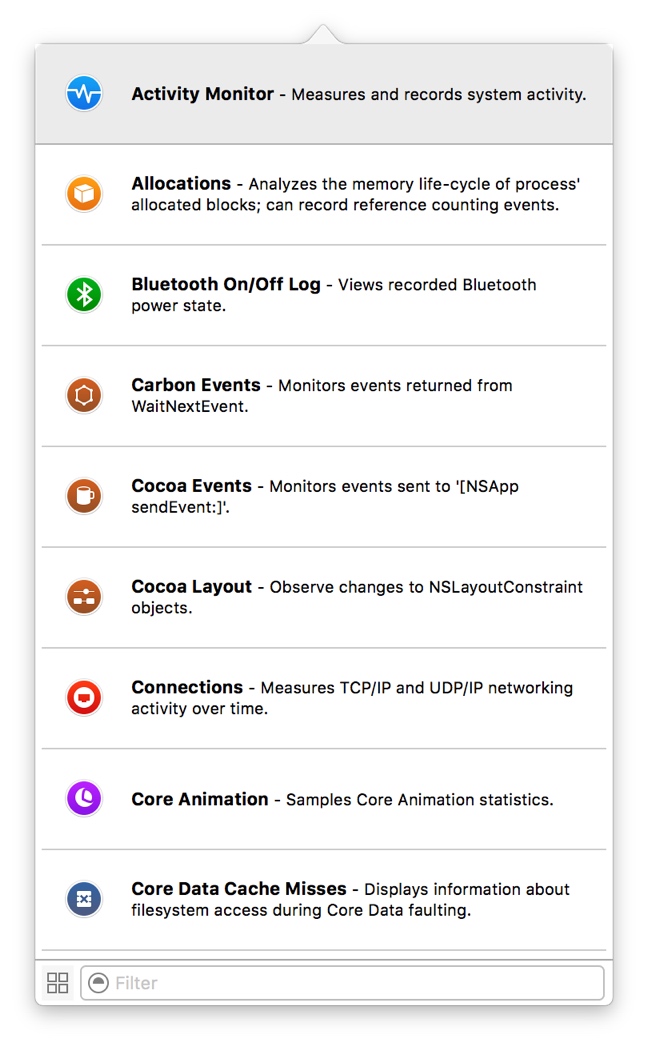
To display the Library palette, choose Window > Library, press Command-L, or click the Add Instrument button (+) in the trace document toolbar. 要显示库调色板,请选择Window>Library,按Command-L,或单击跟踪文档工具栏中的Add Instrument(+)按钮。
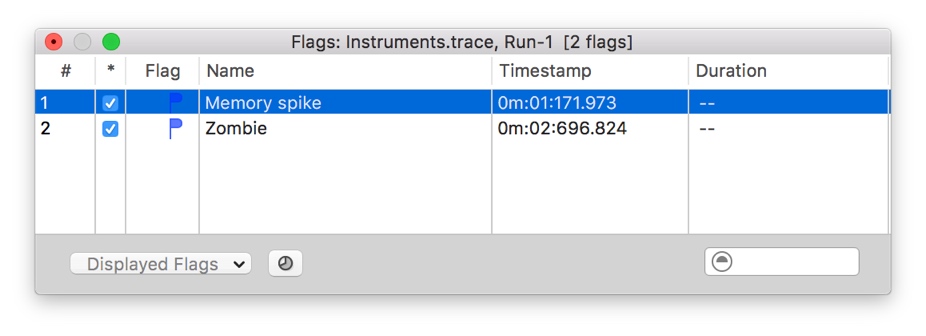
About the Flags palette 关于标志面板
The Flags palette displays a list of any flags you may have applied in the timeline pane of the active trace document. Flags选项板显示了您可能在活动跟踪文档的时间轴窗格中应用的任何标记的列表。
In the Flags palette, you can select a flag to quickly navigate to it in the timeline. You can also filter through a large list of flags for a specific one, show and hide your flags, and view timestamp information about your flags. 在标志面板中,您可以选择一个标志,以便在时间轴中快速导航到它。您还可以通过特定标志的大列表进行筛选,显示和隐藏您的标志,并查看关于您的标志的时间戳信息。
About profiling templates 关于分析模板
In Instruments, you use profiling templates to analyze your app. A profiling template is a trace document that has been preconfigured with instruments and settings for performing a common type of trace. 在Instruments要使用配置模板来分析应用程序。配置模板是一个跟踪文档,预先配置了用于执行公共类型跟踪的工具和设置。
Profiling templates are available when you launch Instruments, create a new document, or initiate a trace from Xcode. You can also create your own templates if you have more advanced or custom needs. 在启动工具、创建新文档或从Xcode发起跟踪时,可以使用分析模板。如果您有更高级的或定制的需求,您也可以创建自己的模板。
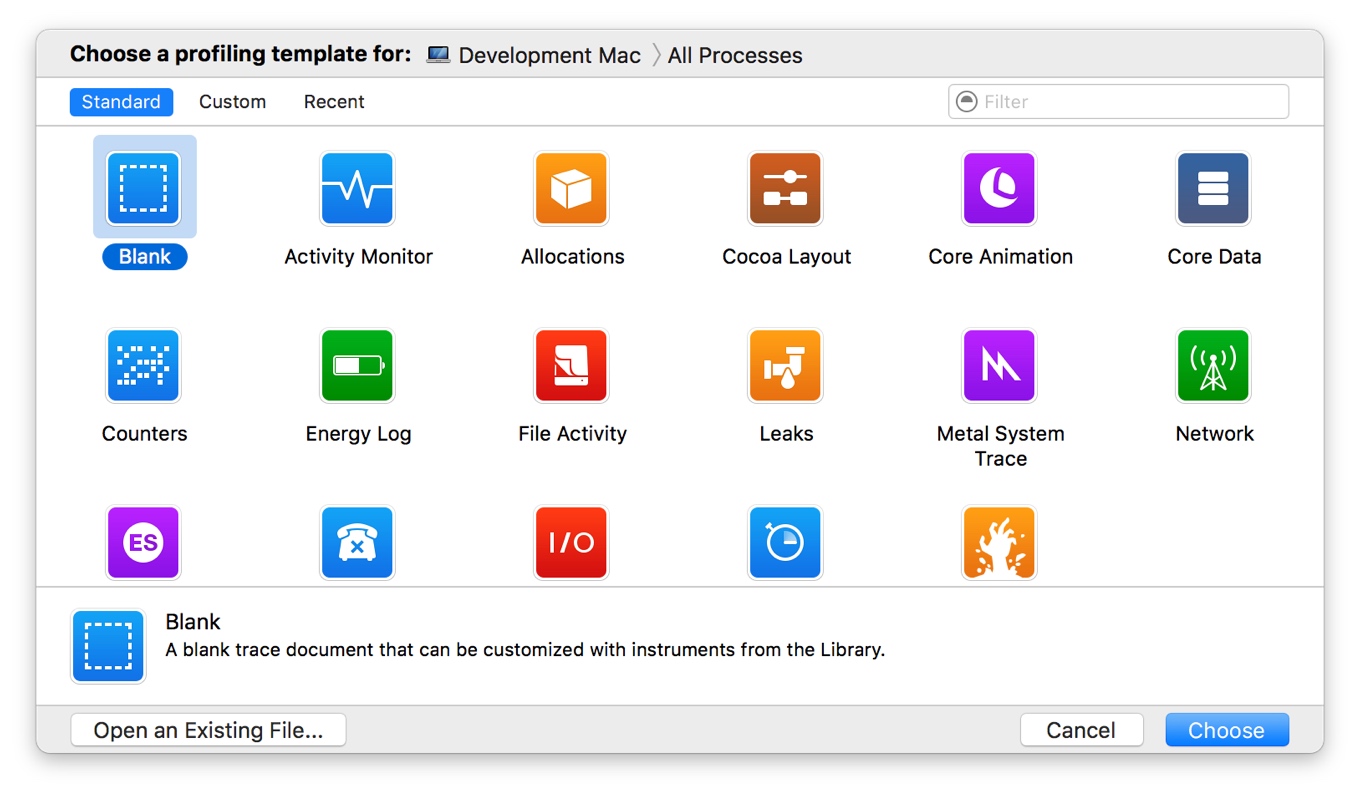
About the profiling template selection dialog 关于分析模板选择对话框
When Instruments launches, you’re presented with a list of profiling templates—files containing sets of preconfigured instruments—from which to choose. This list includes a set of standard templates as well as any custom templates you may have created. 当工具启动时,您将看到一个分析模板列表——包含预先配置的工具集的文件——从中选择。此列表包括一组标准模板以及您可能创建的任何自定义模板。
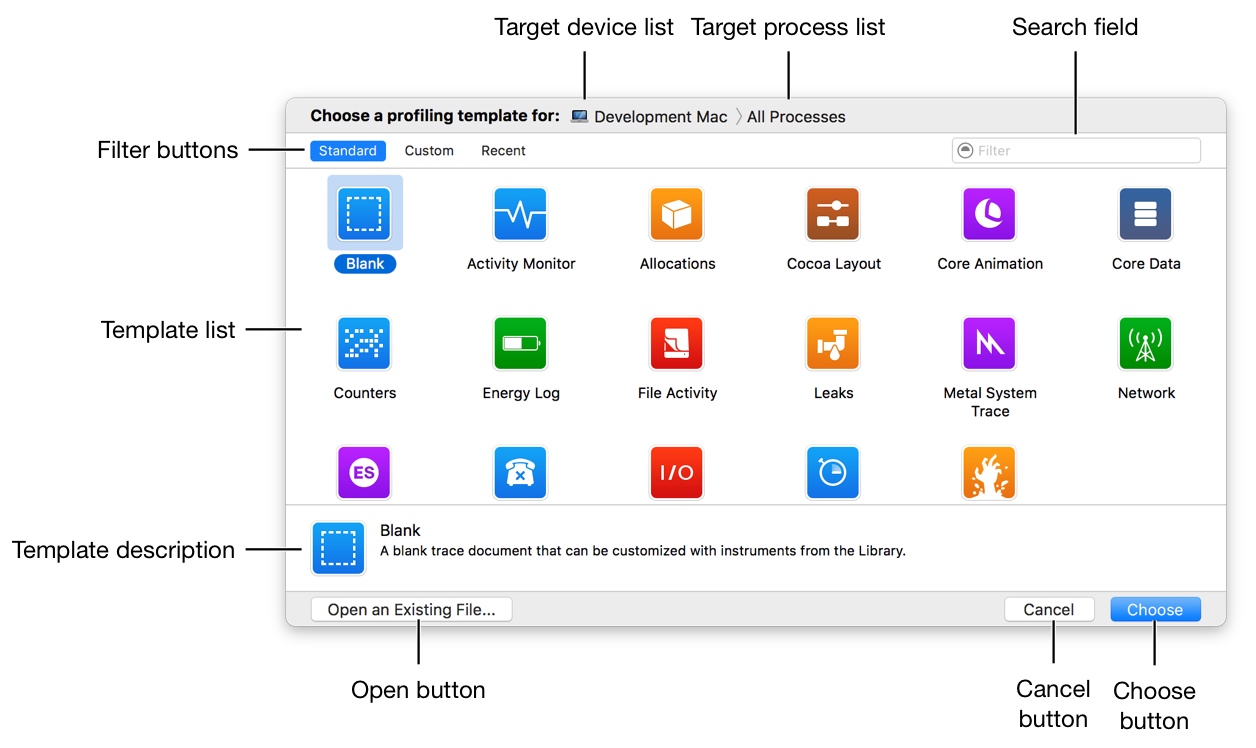
The profiling template selection dialog consists of the following primary elements. 分析模板选择对话框由以下主要元素组成。
-
Target device list: Click this to select the device on which you wish to profile. Target device list: 单击此选择要配置文件的设备。
-
Target process list: Click this to select the process or processes to profile. Target process list: 单击此选项可选择要配置的流程或流程。
-
Filter buttons: Click these to filter down the list of templates to display just the standard templates, custom templates, or recently used templates. Filter buttons: 单击这些选项以筛选模板列表,以显示标准模板、自定义模板或最近使用的模板。
-
Search field: Enter some text to quickly find the template you need. This searches template titles and descriptions. Search field: 输入一些文本以快速找到所需的模板。搜索模板标题和描述。
-
Template list: The list of profiling templates, which may be filtered if you clicked a filter button or entered search criteria. Template list: 配置模板列表,如果您单击筛选按钮或输入搜索条件,可能会对其进行过滤。
-
Template description: A short description of the currently selected profiling template, which can be helpful for determining whether the selected template meets your needs. Template description: 对当前选定的分析模板的简短描述,这有助于确定所选模板是否满足您的需求。
-
Choose button: Click this to create a new profile document, based on the currently selected template. Choose button: 单击此处可基于当前选择的模板创建新的概要文件。
This button changes to Profile when you press the Option key. Click the Profile button to create a new document based on the currently selected template and immediately begin profiling the target process.
-
Open button: Click this to open a previously saved profile document, rather than starting with a fresh template. Open button: 单击此处以打开先前保存的概要文件,而不是从新的模板开始。
-
Cancel button: Click this to close the template selection dialog. Cancel button: 单击此关闭模板选择对话框。
Note: You can display profiling template selection dialog at any time by choosing File > New (or pressing Command-N). 注意:您可以通过选择文件> New(或按Command-N键)随时显示分析模板选择对话框。
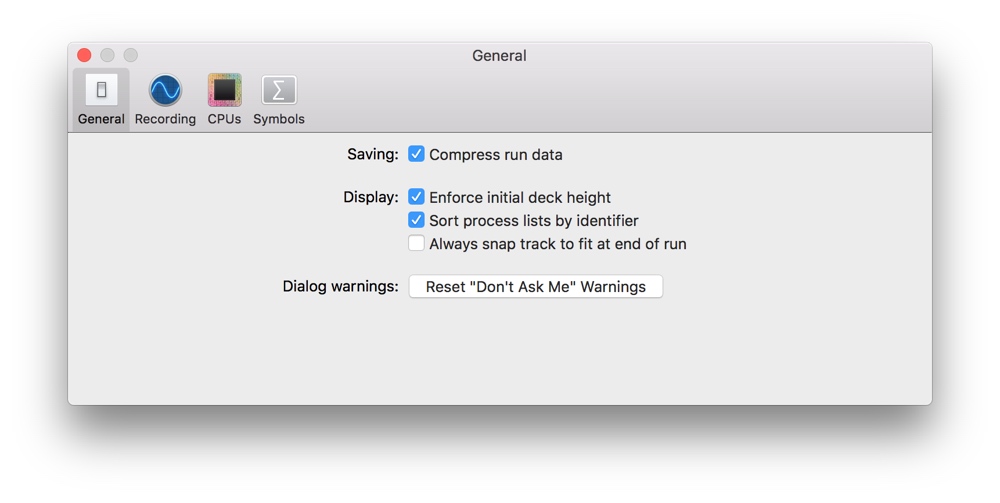
About the Preferences window 关于首选项窗口
The preferences window is used to control various settings related to the behavior of Instruments. preferences窗口用于控制与仪器行为相关的各种设置。
In the preferences window, you can adjust general settings that pertain to startup, saving, and more. You can also adjust recording settings, CPU settings, and symbol preferences. 在preferences窗口中,您可以调整与启动、保存等相关的一般设置。您还可以调整录制设置、CPU设置和符号首选项。